Stock markets have started the year strongly, but are hesitating to build on their new year gains.
The sunspot number has jumped up to near 200 in recent days (see widget on the right side), which may add to nervousness.
But with another week of lunar Green period to go, I am looking for the market to try the upside as soon as the sunspot count wanes to a more normal 100 reading.
Let’s have a look at the Nasdaq index (click for larger image):
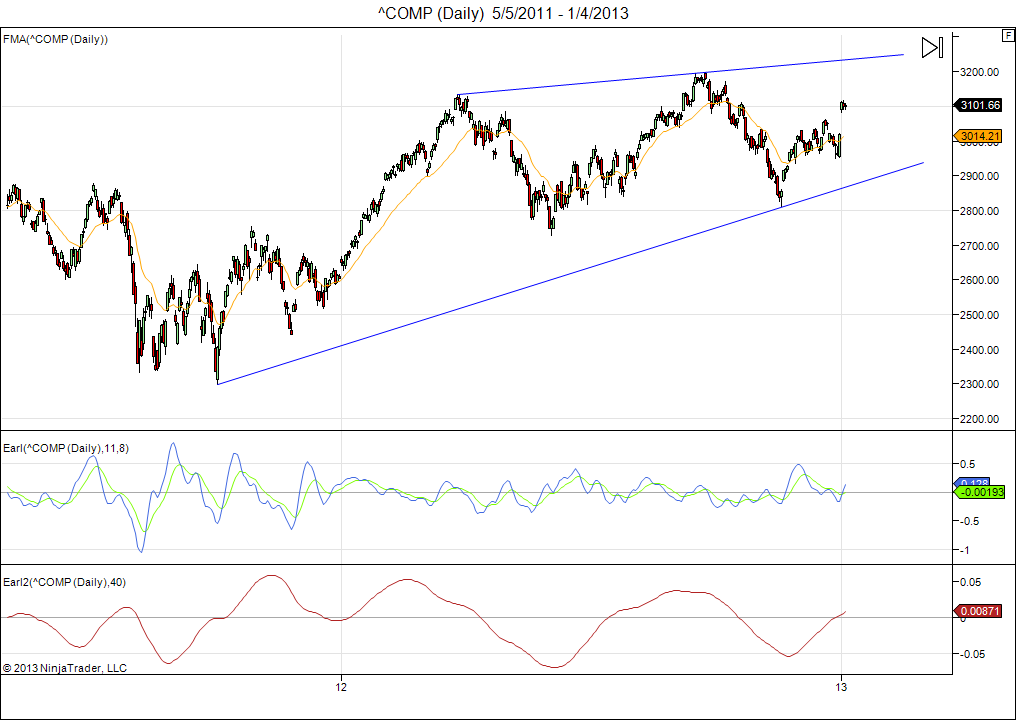
My momentum indicators leave room for further gains. A jump to 3200 remains in the cards, if not this week then in early February.
I do keep an eye on the Earl2 indicator. Once it turns down, probably in spring or summer this year, a market correction becomes quite likely. More about this in the new year forecasts I will release shortly.
***
As chart of the week I take a look at gold prices (click for larger image):
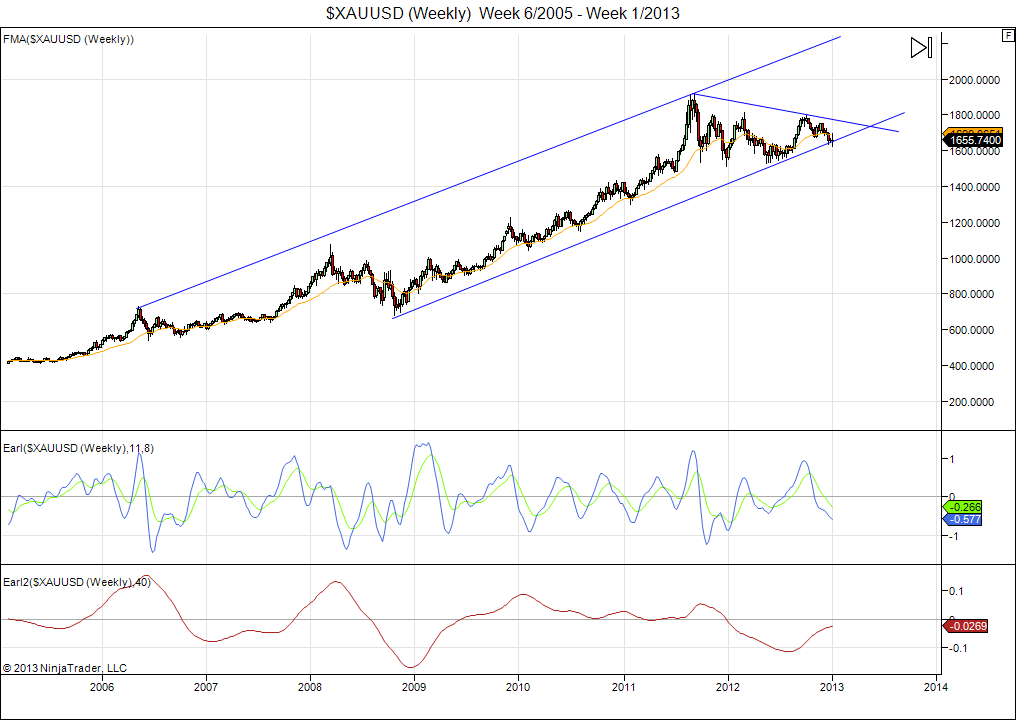
This is a longer term weekly chart. The setup shows good potential to start a rally that would take gold above $2000/ ounce. But a failure to do so pretty soon would probably signal the end of the multi year rise in gold prices.
You can buy gold if:
1) the price rises above $1800, which would confirm a break out.
2) the price makes a “fake-out” drop to $1550, and then rebounds strongly to $1700 or higher.
I would sell if gold drops below $1500.
Good luck,
Danny
