The Nasdaq briefly touched a new high for the year last week, but then sold off and fell through important support levels. The S&P 500 and the Dow Jones Industrials are showing a bit stronger, and are still within their up trends that started last November. What to make of this?
Here is the current chart for the S&P (click for larger image):
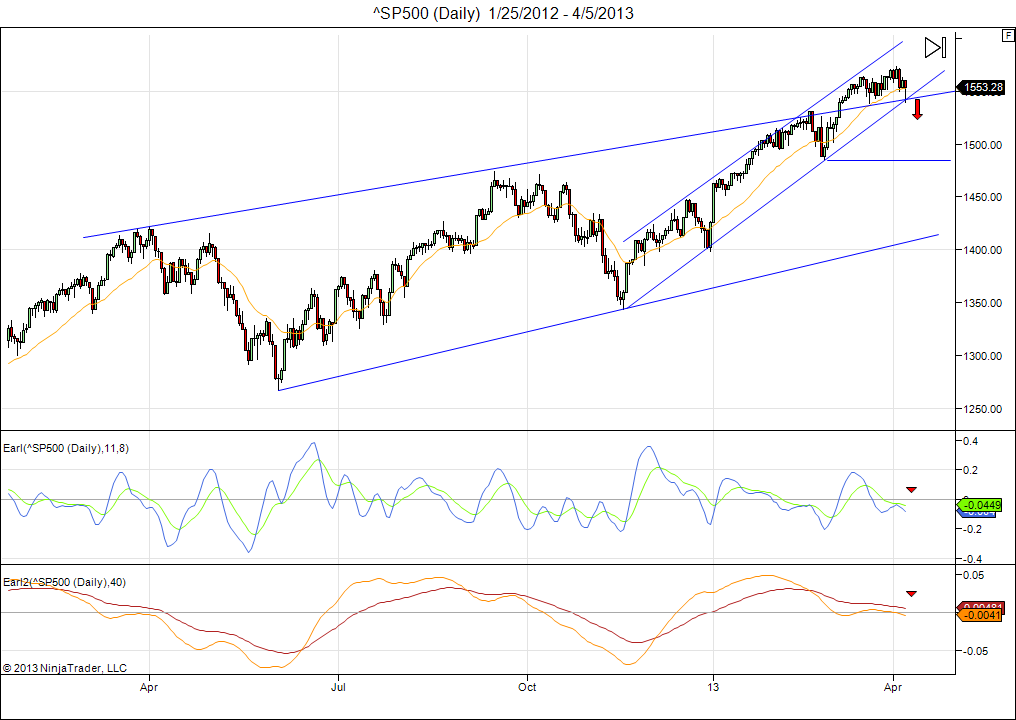
Notice how the S&P is still within the uptrend and has held its support around 1540.
This means we cannot rule out another push towards its all-time high @1576, especially since we remain in a lunar Green period this week. But it will have to happen fairly quick, otherwise the S&P is likely to follow the Nasdaq down by also breaking below its support levels in the next lunar Red period. My Earl indicators also remain negative.
So, for this week I think the market will try to hang on at least for a few more days, keeping hopes alive for putting in a new all-time high, but will then weaken towards the end of the week.
A few weeks ago we put a stop-loss for the S&P at 1540.
Now my stop is moved to 1544, so on a break below that level I would get out and wait for upcoming signs of a bottom.
The first downside target would become 1490 and then 1425.
Later this week I will have some new material on commodity cycles.
So, stay tuned.
Danny
Related articles


