Here is our LT wave chart for next month (click for larger image):
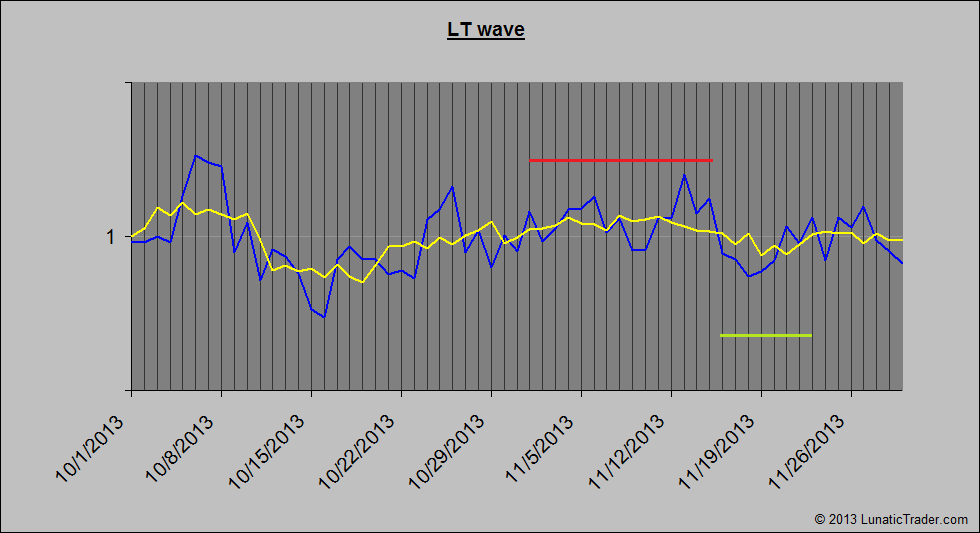
Last month the LT wave didn’t work. The S&P 500 actually bottomed on October 9th and then rose to new record highs, exactly the opposite of what the chart projected.
For November we see a slightly positive bias until the 14th followed by a brief period of weakness in the week surrounding the 19th.
So, let’s see if the normal cycles return.
Danny
Related articles


