Stocks have largely gone sideways in the recent month. It remains unclear whether the next major move will be up or down.
Here is the current S&P 500 chart:
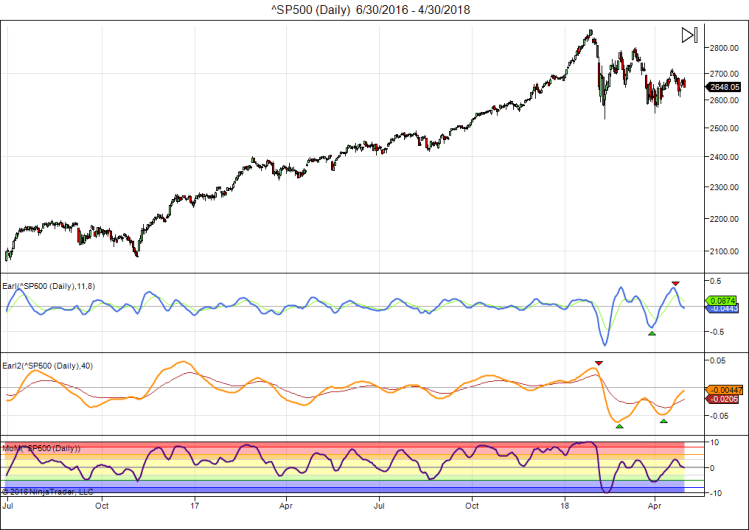
Technically the Earl (blue line) peaked out in mid April and has come down to the neutral line. No signs of a bottom.
The slower Earl2 is still climbing, but appears to be flattening out near the neutral line. And the MoM indicator is also in the neutral zone. None of this offers us any clues about the next move, so all we can do is wait.
It’s time for our LT wave for May:
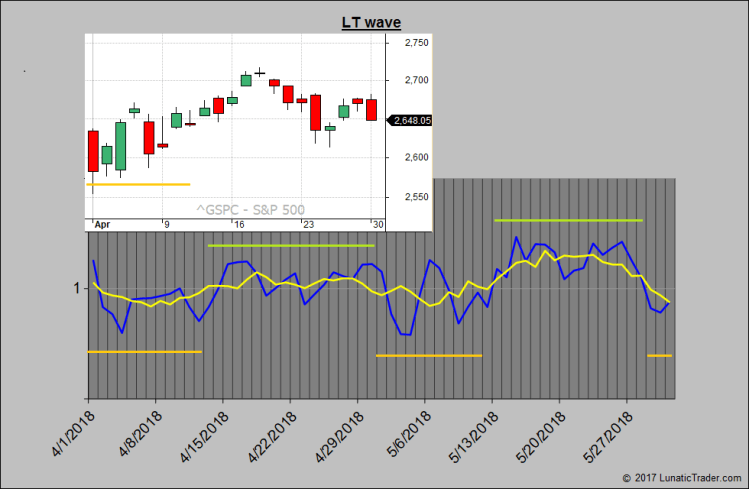
The wave did pretty well in April. Expected weakness until the 12th saw the index hover near support just below 2600. The more positive bias for the remainder of April saw the market test the 2700 levels as we expected. Volatility did clearly drop, so that was a good call too.
For May the wave projects another weak period until around the 11th. This is to be followed by a strong period until the 28th. The final days of May show weak again.
