LT wave had another poor month in August.
The market moved almost completely opposite to the expected pattern throughout the month. Whether that will continue or not is impossible to say. All we can do is be extra cautious and wait for normal situation to return.
Here is the LT wave chart for September:
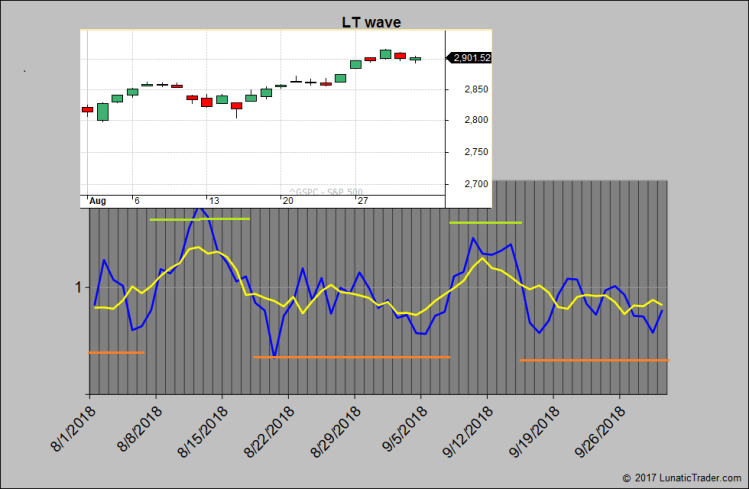
Weakness is expected to continue until Sep 7th. Since this weak period started on August 18 and has seen only rising prices, we could see a sudden late pullback or a simple continuation of those rising prices. There is no way to tell. A strong period is then projected until the 14th. If no pullback is seen before the 7th then we could get a market top in this strong period.
The final weeks of the month look weak again.
Good luck.
