A few days later than normal, but here is the LT wave chart for October.
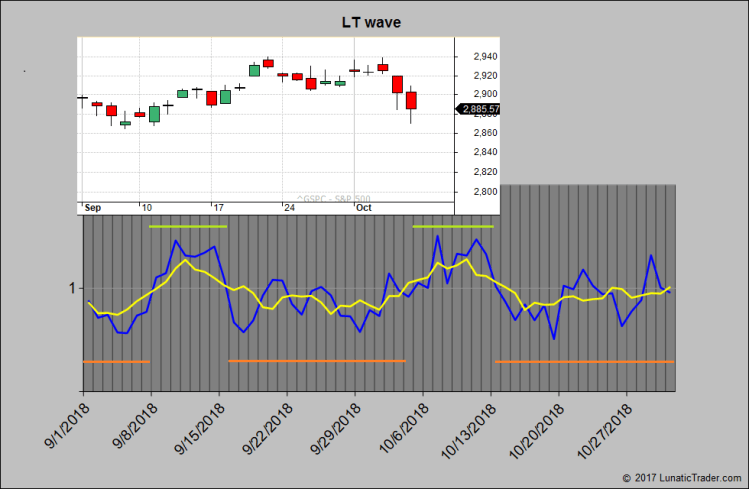
The wave did ok for September with the cycle gradually coming back to normal.
Expected weakness in the first week did happen and was followed by a stronger period. The strong period did last a bit longer than projected.
For October we see the weak period stretching until the 5th. The market has dropped indeed. Next week a stronger period is projected, but whether this will take stocks back up to the recent highs is a big question. I think not, but we will see. The second half of October is also weak, so I would be very careful.
Good luck.

1 comment