The LT wave did a mediocre job in July. Projected strength until around the 10th panned out OK, with the S&P climbing to a new record above 3000 for the first time. The subsequent weak period produced sideways trading, with little or no weakness until the final day of the month.
Here is the LT wave chart for August:
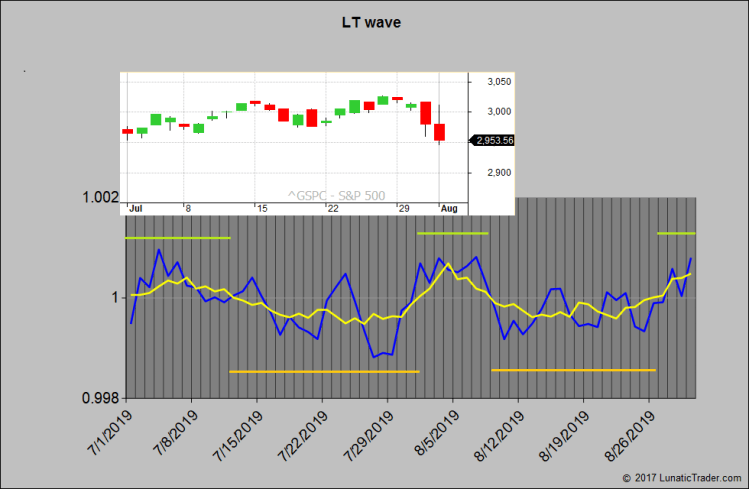
August is expected to start with an upward bias, with a peak value around the 7th. Then a weak period until the 25th. The final days of August look much stronger again.
Reminder for new readers: the LT wave is experimental, so don’t bet the farm on it.

1 comment