The LT wave had a mixed month in June. Here is the LT wave pattern for July with my review and comments for the coming month:
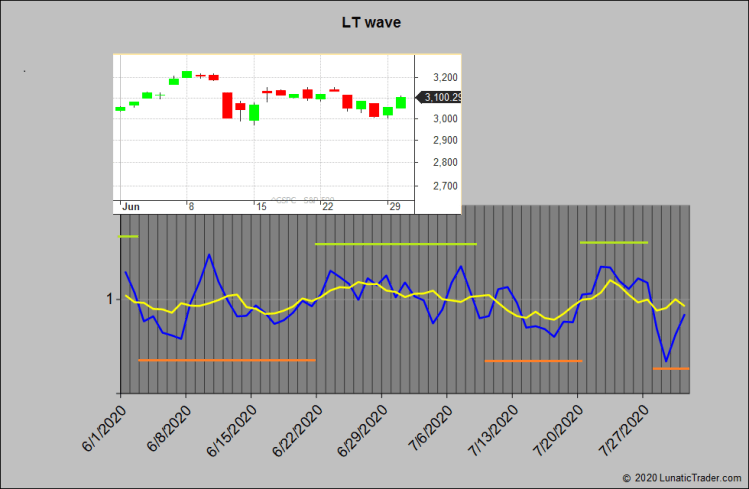
Expected weakness in the first week of June did not pan out and the market peaked on the jump-out peak value on the 10th. The next week saw downside action as indicated by the wave. Projected strength in the final 10 days of the month was slow to show up. More a directionless sideways..
For July the current LT strong period carries on until around the 8th. The middle of the month shows a significant dip. Around the 20th another strong period starts, with renewed weakness in the final days.
The usual caveats apply. Good luck in your trading.

1 comment