October was a very interesting month.
Expected strength in the first weeks came right on target and wiped out the September losses. Projected weakness in the 3rd week only produced a few mild sideways days. And the expected strength in the final days took the index above 4600 for the first time.
Here is the LT wave chart for November:
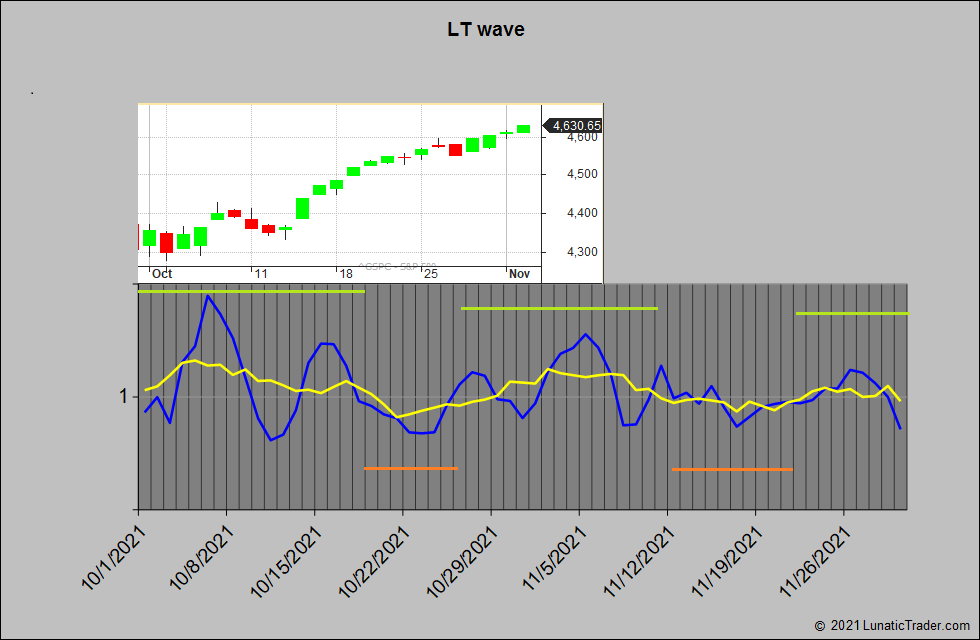
The wave stays positive until around the 11th, with a high peak value on the 5th. Further record highs could be printed in this period. From the 12th until the 21st a weaker period is projected, followed by another strong week. So, it’s very similar to the pattern we had for October.
Whether that will produce similar sized gains is another question. The pattern shows the expected form of the market moves, not the expected size of those moves.
Normal caveats apply: don’t bet the farm on LT waves.

Danny- interesting. See our postings recently that enumerates Nov 5 ’21 and onwards. [VectorSpike on McVerry report]