Another good month for the LT wave in January.
Mild weakness in the first week came as expected and was followed by the stronger period the wave had indicated, giving us a 250 point rally. In the final days of the month we had a bit of a pullback. Doesn’t get much better.
Here is the LT wave for February:
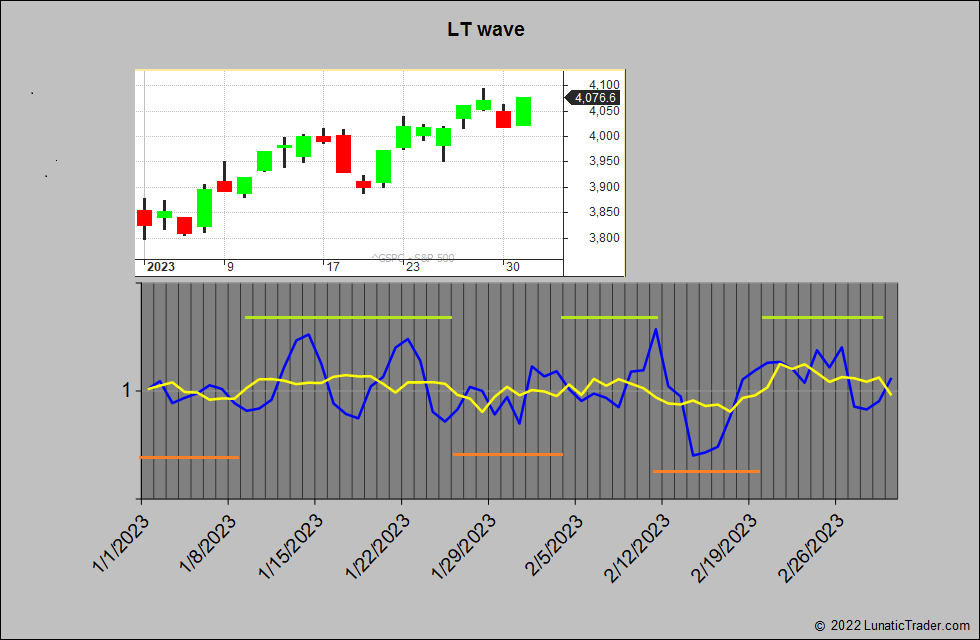
We have a rather neutral read in the first days (going by the yellow line), and then a stronger period until around the 11th (which has the highest value of the month in the shorter term blue line). Then weakness until the 19th and stronger again for the remainder of the month.
Normal caveats apply: the LT wave is experimental and doesn’t use any market or price inputs. Don’t bet the farm on it.

1 comment