The LT wave didn’t perform well in February.
The expected stronger period until the 11th only gave us a sideways. And that sideways pause continued for most of the subsequent weaker period. The projected strength for the final 10 days of February didn’t even produce a single good up day. It doesn’t get much worse than that, but so it goes.
Here is the LT wave pattern for March:
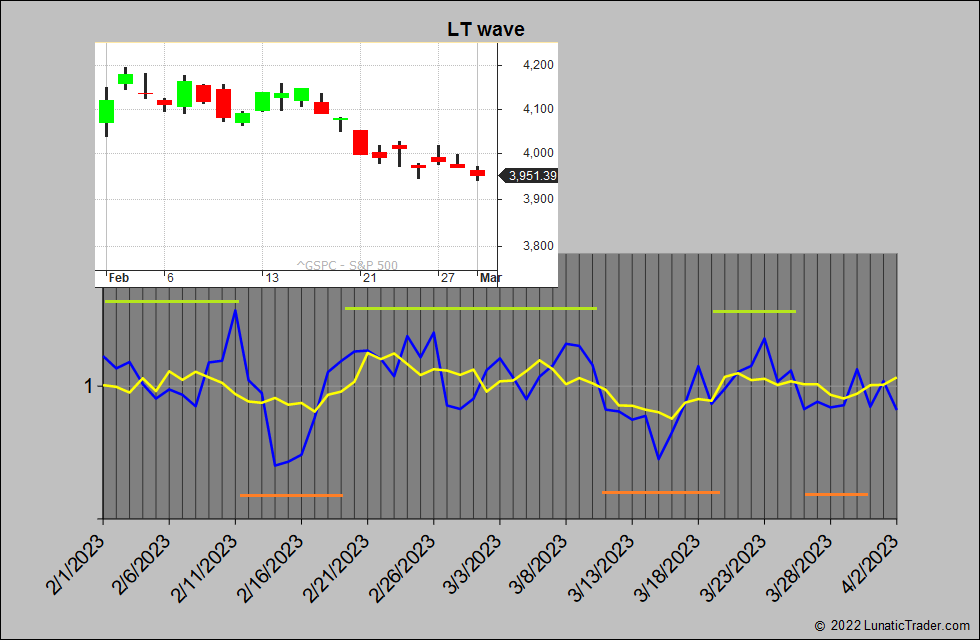
The strong period continues until around the 10th and then followed by weakness until the 19th. Then some stronger days until the 25th, with mild weakness again to end the month.
Normal caveats apply: the LT wave is experimental and purely based on natural cycles, so doesn’t use any market or price inputs. Don’t bet the farm on it.
Subscribe to our blog if you want to get an email each time we post new information. It’s free.

1 comment