The LT wave went out of sync for most of April.
The expected strong start didn’t materialise and then stocks climbed in the projected weaker period. The second half of the month was rather weak, against expectation, but the final days brought prices back up. Here is the LT wave for May:
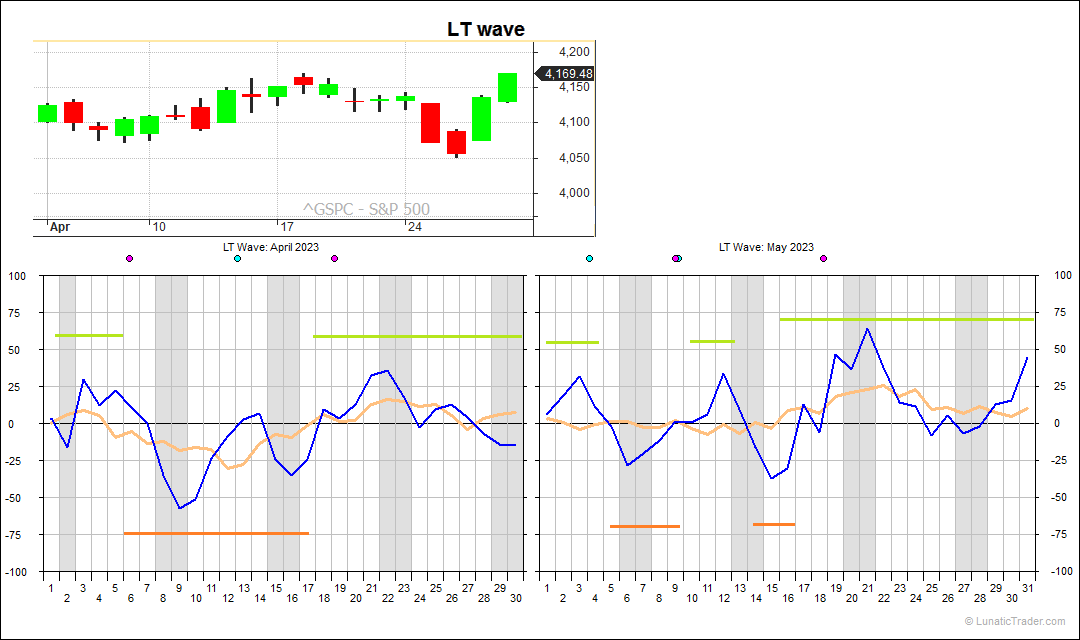
The first two weeks are rather neutral going by the orange smoothed line, but the shorter term blue line shows us strength on weekdays with dips below zero over the weekends and Mondays. Around the 16th a strong period starts until the end of May, with some possible weakness around the 26th.
Normal caveats apply: the LT wave is experimental and purely based on natural cycles, so doesn’t use any market or price inputs. Don’t bet the farm on it.
Subscribe to our blog if you want to get an email each time we post new information. It’s free.

1 comment