The LT wave had a good October.
Projected weakness in the first week was followed by a rally in subsequent stronger period, reaching the high for the month early in the third week. Then a serious decline followed, starting a few days earlier than expected, taking the market down 300 points by the end of the fourth week. Renewed strength in the final days also came right on the mark. It doesn’t get much better. Here is the LT wave for November:
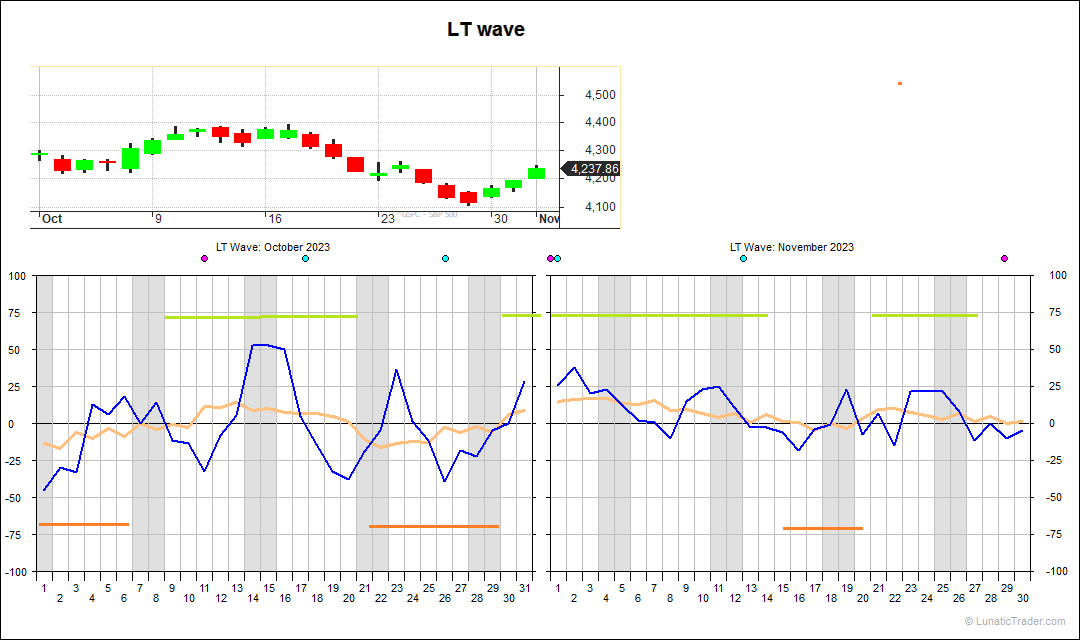
Current strength is expected to continue until the middle of the month. Then a brief weaker period. Around the 21st some strength reappears for a couple of days, possibly until the 24th. The rest of the month is close to neutral.
Normal caveats apply: the LT wave is experimental and purely based on natural cycles, so doesn’t use any market or price inputs. Don’t bet the farm on it.
Subscribe to our blog if you want to get an email each time we post new information. It’s free.

Great work Dan. Really enjoying your posts. This is an area that I’ve been interested in and researching myself off and on for the past 25 years. Keep up the great work!
Thanks.