The LT wave had another mediocre month in October.
The expected strength in the beginning of the month extended a few days longer then projected. The projected weakness starting in the third week was quite mild and stocks kept going sideways in the final week. When expected strength fails to show up it can be a sign of underlying weakness in the longer term trend, but that remains to be seen. Here is the LT wave for November:
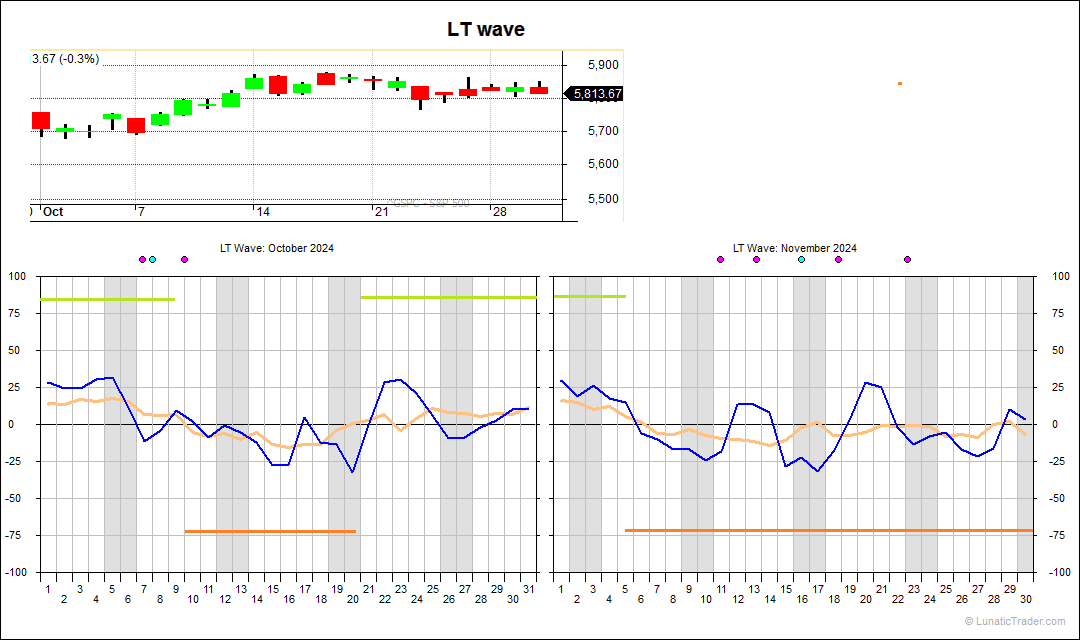
The current stronger period lasts until the 5th, which happens to be US election day. From then onwards the rest of the month is mostly weak, but a few stronger days are possible in the middle of second and third week, as indicated by the blue line.
Normal caveats apply: the LT wave is experimental and purely based on natural cycles, so doesn’t use any market or price inputs. Don’t bet the farm on it.
Subscribe to our blog if you want to get an email each time we post new information. It’s free.

1 comment