The LT wave had a good month in November.
The expected strength in the beginning of the month lasted a few days longer then projected and took the index above 6000 for the first time. The subsequent weakness was obvious in the second week, and the stronger days in the third week allowed the market to bounce back. Then traded mostly flat near 6000 for the rest of November. Here is the LT wave for December:
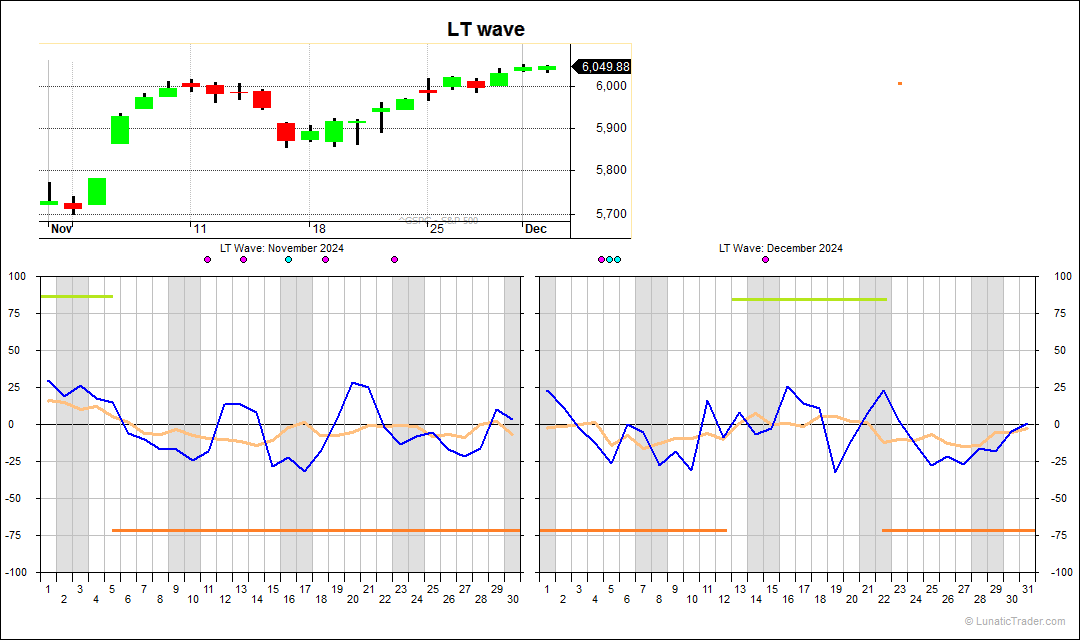
First we see weakness until around the 12th. Then some stronger days, especially in the 3rd week. But even then the orange average line is barely getting above zero. The last 10 days of the month are again on the weaker side. Usually December is one of the stronger months of the year, so it will be interesting to see what this gives. Happy holidays to all readers
Normal caveats apply: the LT wave is experimental and purely based on natural cycles, so doesn’t use any market or price inputs. Don’t bet the farm on it.
Subscribe to our blog if you want to get an email each time we post new information. It’s free.

Thanks Dan love your work. Looking for what the LT wave has for new year. Wish you & your readers Merry Christmas!
Thanks Nifty. All the best for 2025.