The LT wave did well in February.
The first week ended sideways and the subsequent stronger period saw the market go back up to 6100+. The weaker period starting on the 19th then took the index down to well below 5900. Expected strength in the final days failed to show up however, with the exception of one large green candle on the 28th. But that’s not too bad, we can’t expect perfection every month. Here is the LT wave for March:
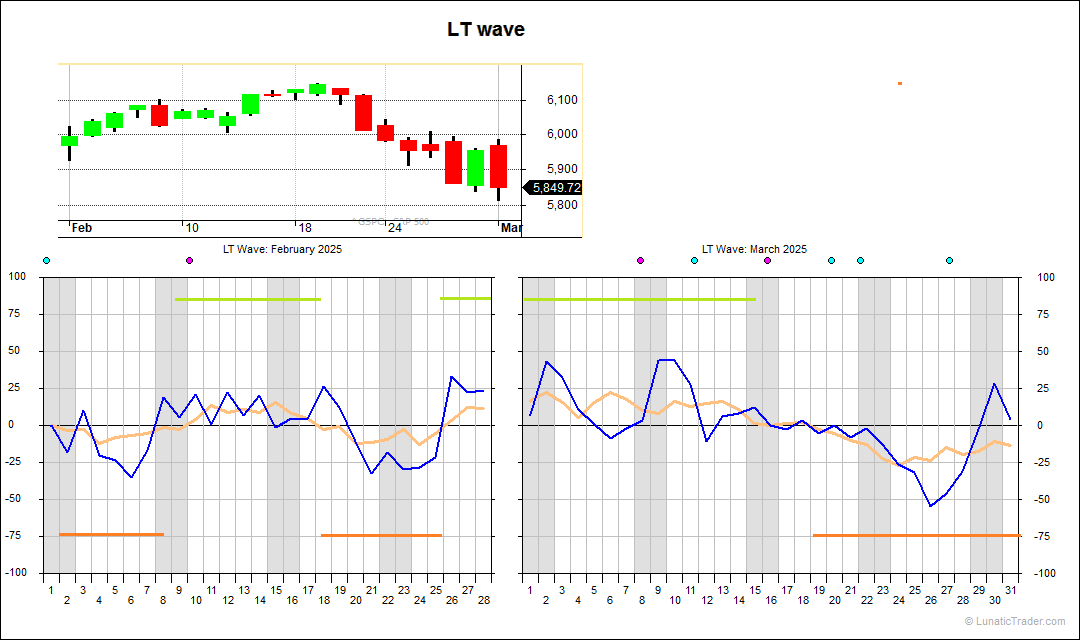
The pattern is very simple this month. A strong first two weeks, then a few neutral days and a weaker period again from the 19th onwards.
The usual caveats apply: the LT wave is experimental and purely based on natural cycles, so not on market or price data. Don’t bet the farm on it.
Subscribe to our blog if you want to get an email each time we post new information. It’s free.

1 comment