The LT wave had another poor month in April.
The market crashed in the first week, then rebounded quite sharply in the second week, when the projected stronger period ended. The subsequent weaker period saw another decline, but the lows were not retested. The month did end on a stronger note, as expected, with the rally starting a few days earlier than the wave had indicated. Not great, but it suggests that the normal cycles are gradually getting back on track. Here is the LT wave for May:
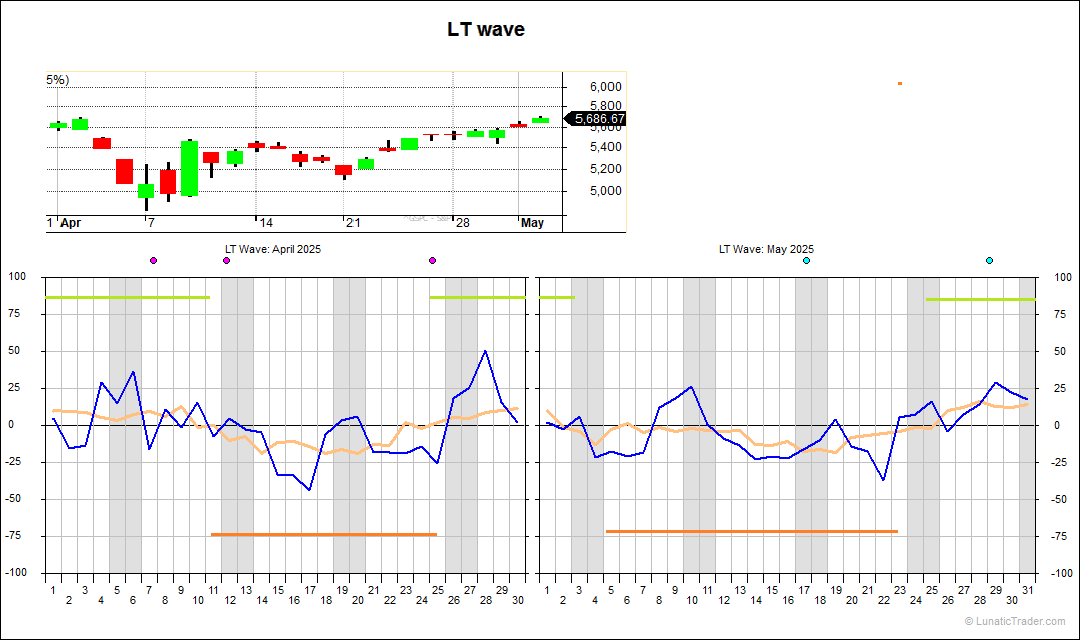
The current stronger period ends around May 2nd, and is followed by a weak period until the 22nd. The blue line suggest a few stronger days are possible on the 8th and 9th. The month ends with a stronger period, starting around the 23rd.
The usual caveats apply: the LT wave is experimental and purely based on natural cycles, so not on market or price data. Don’t bet the farm on it.
Subscribe to our blog if you want to get an email each time we post new information. It’s free.

1 comment