The LT wave had a good month in June.
The SPX climbed back above 6000 in the expected strong first week. The second and third week were projected to be weaker and gave us a sideways pause. And in the subsequent stronger period starting on the 23rd the market climbed to new record highs. We can’t ask for more. Here is the LT wave for July:
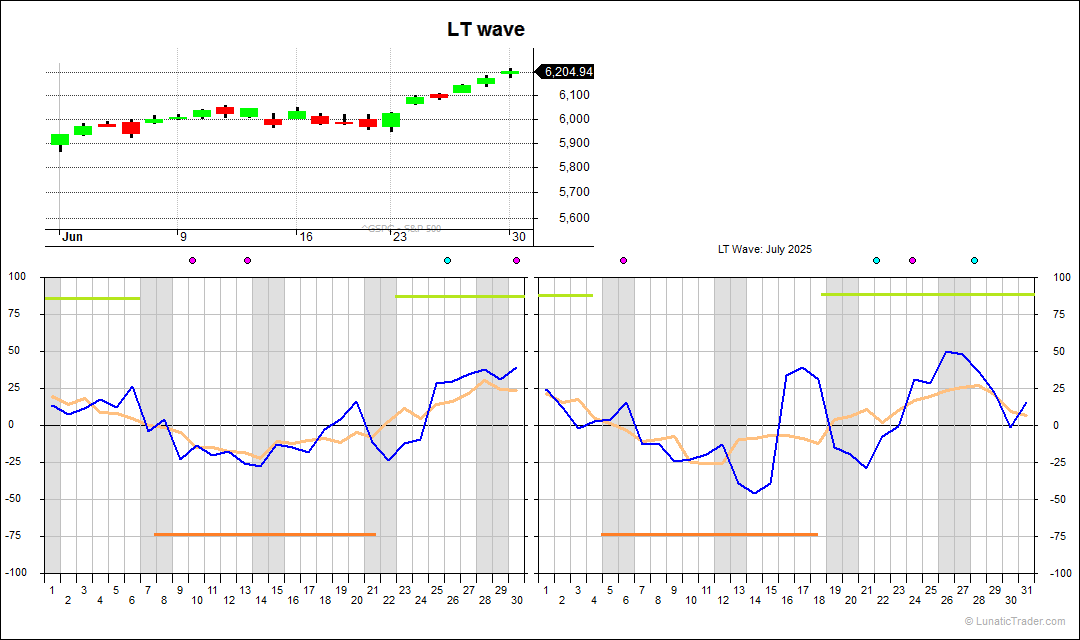
Strength is projected for the first days, but it wanes quickly. From the 4th (when US market will be closed) until the 18th a weaker period follows. This weak period could end a few days early, because the shorter term blue line already jumps to a significant high on the 16th and 17th. The final ten days of the month are expected to be strong.
The usual caveats apply: the LT wave is experimental and purely based on natural cycles, so not on market or price data. Don’t bet the farm on it.
Subscribe to our blog if you want to get an email each time we post new information. It’s free.

1 comment