The LT wave had another good month in July.
The SPX climbed to near 6300 in the first week, when strength was expected. Subsequently the market chopped sideways until the middle of the month, in the weaker period. And then the market climbed to new record highs again in the subsequent stronger period. The final days of the month were already getting weaker, and even that was visible in our graph. We can be happy with that. Here is the LT wave for August:
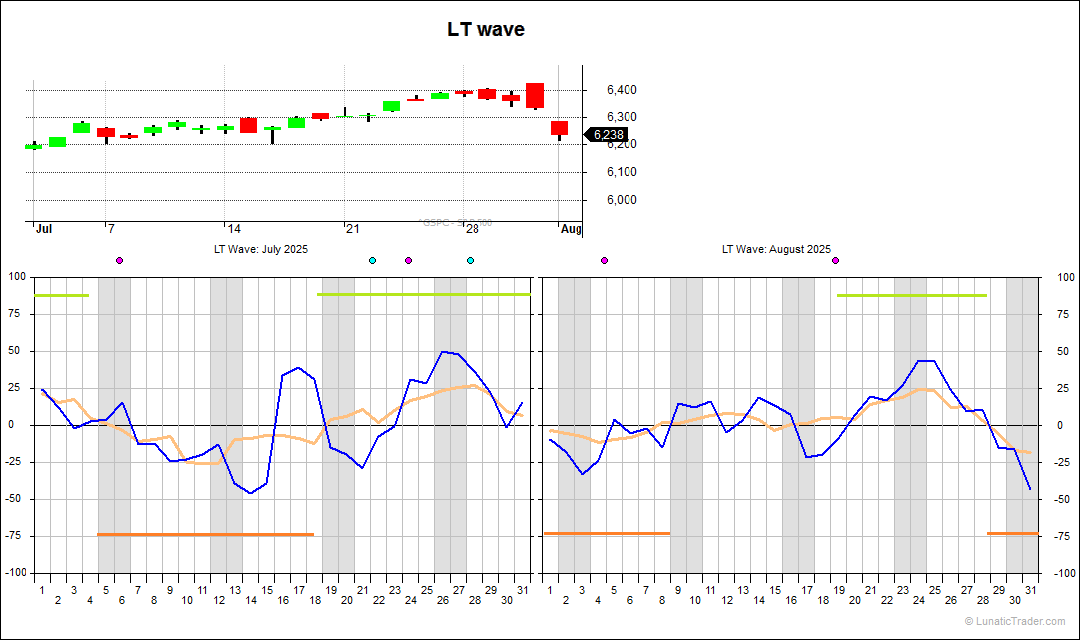
Weakness is projected until around the 8th. Then we have a neutral period, chopping very close to the zero line, until the 18th. Such neutral periods can go either way, and that can give useful clues about the path of least resistance. From the 19th until the 28th there is another strong period. And the final days of the month are weak.
The usual caveats apply: the LT wave is experimental and purely based on natural cycles, so not on market or price data. Don’t bet the farm on it.
Subscribe to our blog if you want to get an email each time we post new information. It’s free.

Hi Dan,
I just resent my inquiry to you and double checked the email you wrote here; which I did use. Could you kindly look after this. I have resent my license number and old email addy.
Million thanks as I love the program.
Doris
Hi Doris, We received your mails and just replied. Check your mailbox. Thanks.
Dan
Hi Dan,
Thx for blog comment. I need to reregister my software on my new Windows 11
computer. Please be in touch to do so as I have a lifetime license and cannot access my software yet on the new computer without your input.
Best
Doris Rudnick
Hi Doris,
You need to email us for any technical support questions. Include your earlier order number, name or email that was used when you bought the program.
Send it to: 8v9sw8v0z@mozmail.com
Regards,
Dan