The LT wave did quite well again in October.
The market went flat in the first days that were expected to be weaker. The subsequent stronger period started ok, but there was a sudden big down day on the 10th. That happened to be a very low couple of days in the blue line (shorter term). Sometimes that blue line pattern takes over, sometimes such days just pass by. Stocks then kept going up until early in the final week, reaching new record highs. The final days were weaker, as projected. Not perfect, but that’s how it is. Here is the LT wave for November:
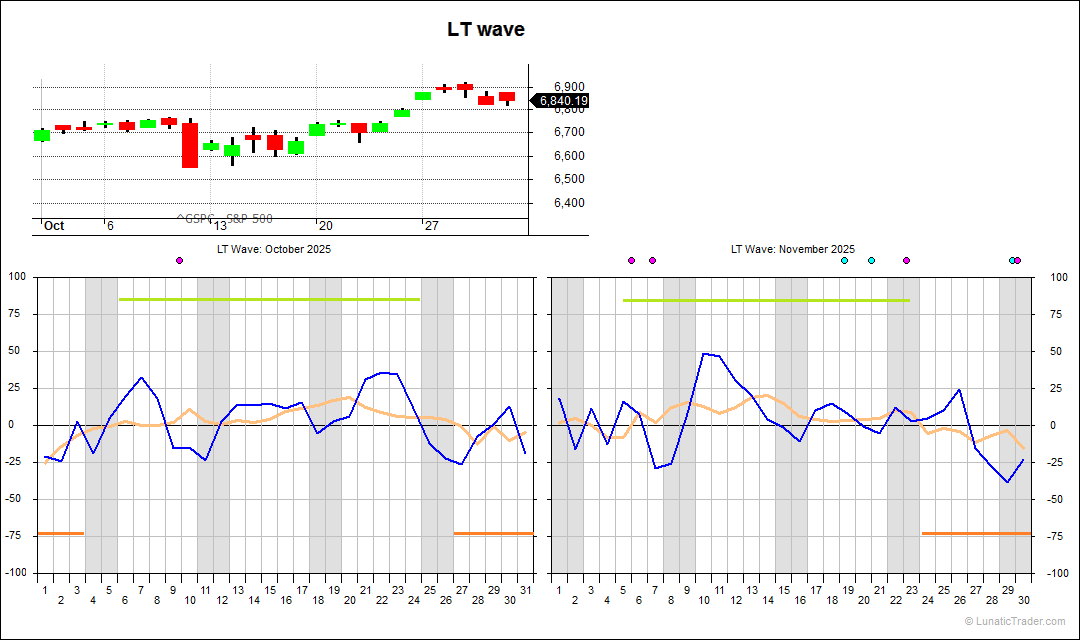
Very close to neutral in the first days, followed by a stronger period that starts around the 6th. The third week is only just above neutral, but it leans positive, so we count it in. Weakness in the final week again.
The usual caveats apply: the LT wave is experimental and purely based on natural cycles, so not on market or price data. Don’t bet the farm on it.
Subscribe to our blog if you want to get an email each time we post new information. It’s free.

1 comment