-
Outlook for world markets with our comments for next week. If you have any trouble to see the presentation below, then click here. Click the “Expand” button (bottom right) to watch in full screen mode. * The latest weekly reversal levels for over 2500 stocks and ETF can be found every weekend at http://www.reversallevels.com/. *…
-
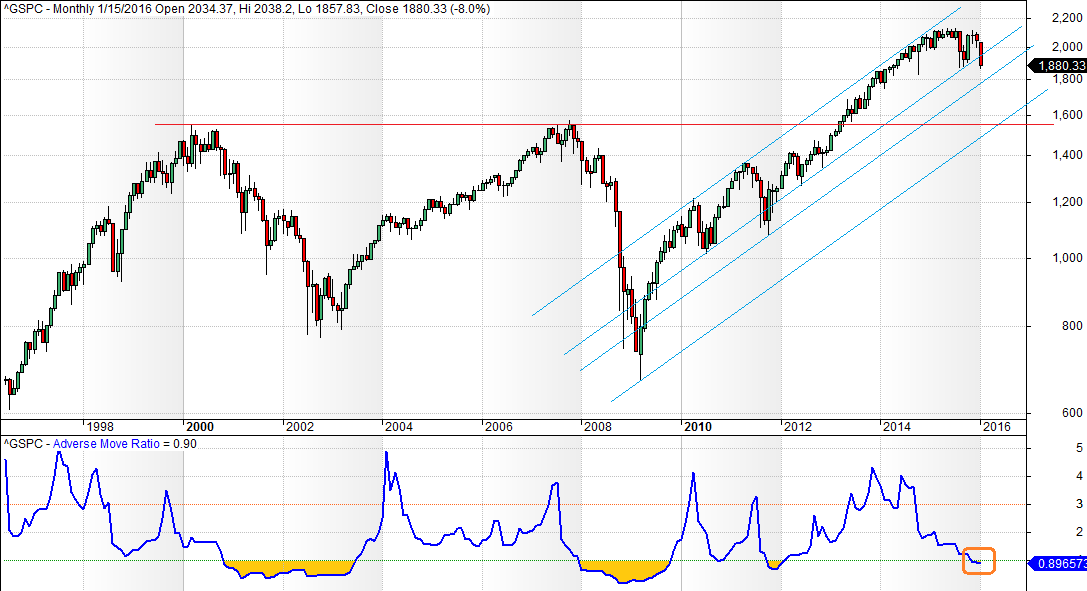
Stocks continued to sell off last week and last year’s lows are being tested. Is this the start of a major bear market? Or is the correction all but over? To find an answer to this question we will take a look at the “adverse move ratio”, but let’s check out the current chart for…
-
Outlook for world markets with our comments for next week. If you have any trouble to see the presentation below, then click here. Click the “Expand” button (bottom right) to watch in full screen mode. * The latest weekly reversal levels for over 2500 stocks and ETF can be found every weekend at http://www.reversallevels.com/. *…
-
Stock markets went into a steep slide last week, producing one of the worst starts to a new year ever. I wrote last week that the shorter term indications tend to pan out first, and that’s what we are getting. This gives us a new situation in the Nasdaq chart (click image to enlarge it):…
-
Outlook for world markets with our comments for next week. If you have any trouble to see the presentation below, then click here. Click the “Expand” button (bottom right) to watch in full screen mode. * The latest weekly reversal levels for over 2500 stocks and ETF can be found every weekend at http://www.reversallevels.com/. *…
-
In part 1 of this series I tried to explain why having a trading method is important. Somebody may have the body and the talent to be a top tennis player, but if he steps on the court without a clear game plan then he is not likely to win Wimbledon. An investor may have…
-
Stocks had a weak santa rally and the S&P 500 ended the yearly nearly unchanged. The S&P remains confined to the 2000-2100 range and the next major event is going to be when stocks break away from that range, up or down. Let’s have a look at the chart (click image to enlarge it): The…
-
Outlook for world markets with our comments for next week. If you have any trouble to see the presentation below, then click here. Click the “Expand” button (bottom right) to watch in full screen mode. * The latest weekly reversal levels for over 2500 stocks and ETF can be found every weekend at http://www.reversallevels.com/. *…
-
It is the last trading day for 2015, a good opportunity for a little look at what has been and, more importantly, at what may be ahead… It looks like the S&P 500 will end the year very close to unchanged, which is quite rare. More on that below. The sideways range made it a…
-
The last trading days of the year are showing a light upward bias, as they typically do. It is usually hard to read something in days with very light trading, so we will probably have to wait for next week to see where stocks are going next. Let’s have a look at the Nasdaq chart…
-
Subscribe
Subscribed
Already have a WordPress.com account? Log in now.
