Stock markets had another rough week. We got the serious down days and the nervousness I warned for in last week’s post. Now the question becomes whether the August lows will be revisited or not. Let’s have a look at the Nasdaq chart (click image to enlarge it):
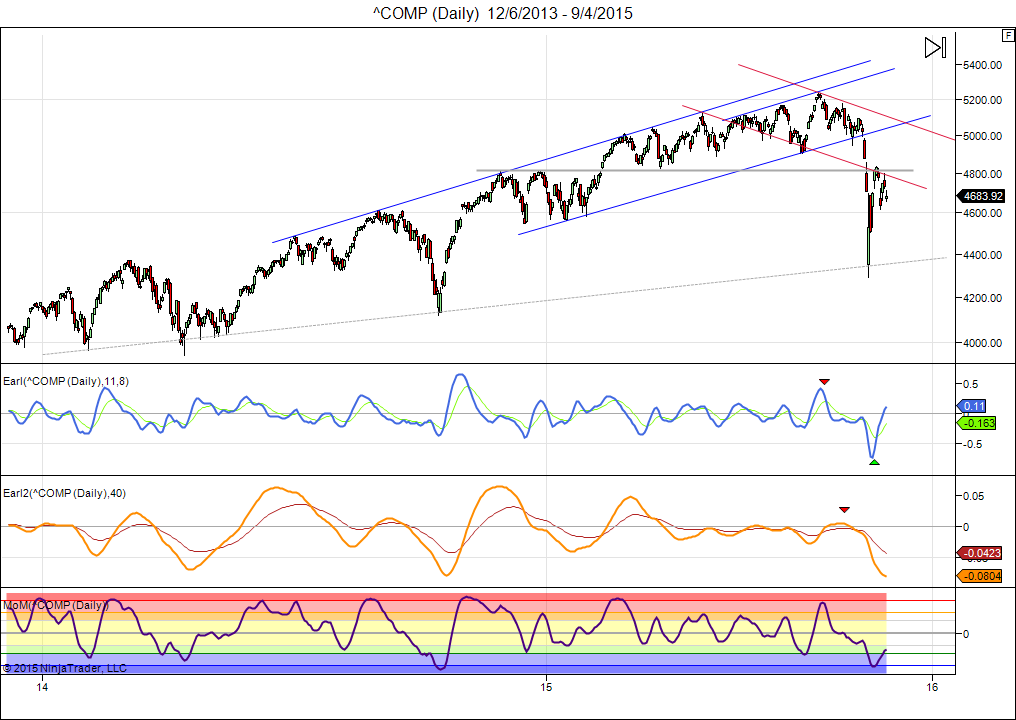
We are in a new lunar green period, but that has not resulted in a sustained upward move so far. Meanwhile the Earl and MoM indicators keep going up, while the slower Earl2 (orange line) is about to bottom out at a deep low, on a par with the major lows it reached in April and October 2014. Three weeks ago I recommended to stay very cautious until we see a clear bottom in the Earl2 indicator. The Earl2 is now flattening out and will probably turn up in the next few days, so now is the time to start looking for some bargains.
Major upward resistance is near 4800, the late 2014 highs. And support is probably just below 4600, the January lows.
I would also like to point out that the Skew index hit a very high 142 last Friday. This means that a lot of crash insurance was being bought and unusually high premiums were being paid. Fear is very high in the market. From March until a few weeks ago the Skew rarely went above 130 and mostly traded near 120. This means investors weren’t all that worried and didn’t buy much crash insurance (if any). But now that we have seen a market drop the Skew is suddenly jumping to its highest level in almost a year. This is an example of buying boots after the flood. See the article on Skew index that I posted earlier this year: Forget the VIX, watch the SKEW. This suggests we are in a short term correction, not at the start of a long bear market. Throughout the bear markets of 2000-2003 and 2007-2009 the Skew consistently stayed low and didn’t even get above 130, much less 140. A low Skew means complacency, a high skew means fear. So, right now we have fear. And as the saying goes, it is time to buy when others are fearful.
Some people have been asking for more Iceberg charts. I will try to do one very week. We will start with gold (click image to enlarge it):
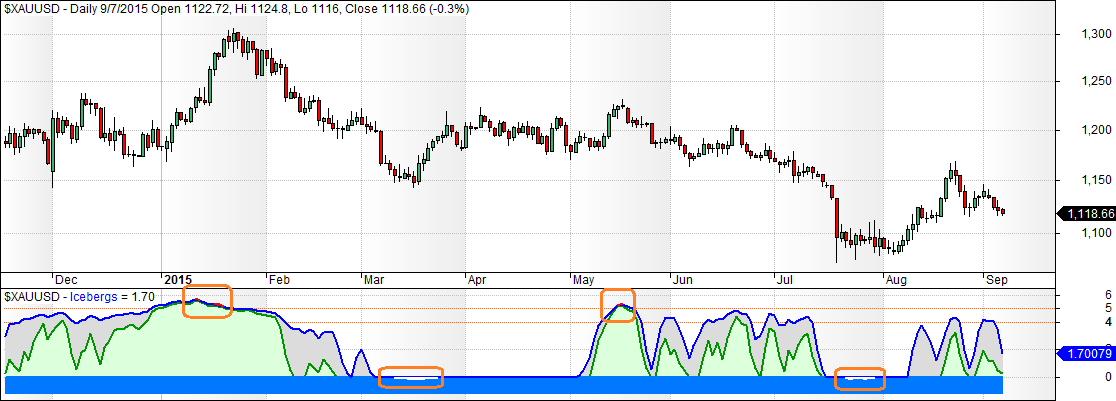
Gold had a nice bout of bullish energy (green) in the beginning of 2015. “Lava” marked the peak in January. “Floating ice” appeared at a bottom in March. Some erratic bullishness showed up in May and June, but that hardly managed to keep the market flat. “Floating ice” marked the next bottom in July. And now we have had another rally attempt, but bullish energy is even weaker than on the previous occasion. It has only painted a few “small islands”. In a healthy bullish market the amount of green climbs above 4, and that’s what I would wait for if you are looking to buy gold for long term.
If you missed out on my earlier article introducing the Iceberg charts, you can find it here.
Danny

19 sep 2014 skew(146,08) SP 2010 then the largest decline begins to 1810s.Fear high and others are fearful you’re saying it is time to buy.You explain that I did not understand .
Hi Ege,
See my earlier article on this topic: https://lunatictrader.wordpress.com/2015/04/20/forget-the-vix-watch-the-skew/
(forgot to tick the box for new comments via email so making another post – sorry for clogging up the comments)
No problem.
Thanks very much Danny. Excellent as always.
I think gold will probably re-test the July/August lows. I’m watching NUGT (a gold miners 3x leveraged ETF) and plan to start dripping money in at $2 and below. Anyone reading this – don’t take this as advice – DYOR.
Thanks Alan. Leveraged etf are one of the ways to play it. Wouldn’t use the leveraged etf for holding longer term though, because they tend to suffer from gradual “erosion”.
Yes, absolutely.