Stock went mostly flat for another week and have ended the lunar red period with a 17 point gain for Nasdaq. More often than not sideways price action resumes in the direction of the existing trend, and with a new green period starting we could easily get another push to new highs in the coming weeks. This is the current Nasdaq chart:
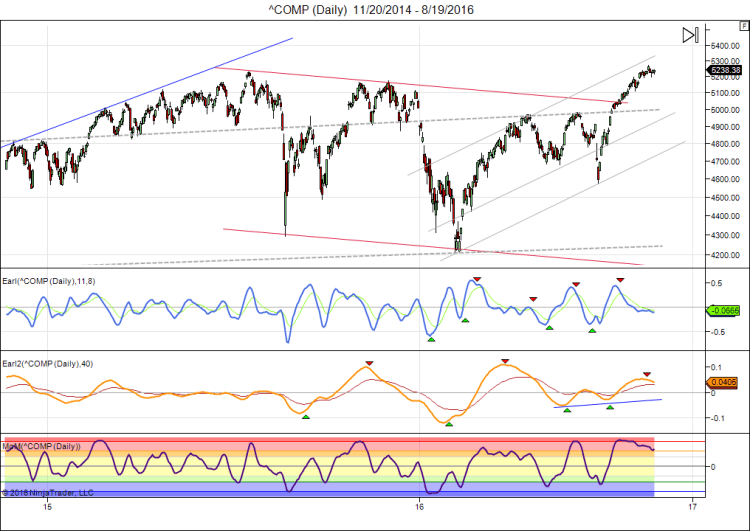
The technical situation is not clear cut. The slower Earl2 (orange line) has turned down, which is a warning sign. But the faster Earl (blue line) is just below the neutral and may turn up for another brief spurt higher. If so I would look for 5300-5400 as a possible zone for a peak.
A failure to rally would probably send the market the other way and then Nasdaq may face a drop to 5000-5100.
There is no easy play to make at this point, so I would just stick to long term positions and wait for better setups when it comes to swing trades. Looks like another good week to stay on the beach rather than in front of a monitor.

Danny, I have the downloaded the software and my first impression is that it is worth while. Would it be possible to get the ebook in trail period so I can fully make use of the first month to test. Thanks
Hi Ivo,
There is a brief Help file as well as two tutorials that can be accessed from within the program.
They are sufficient to get a quick grasp of what the program does and doesn’t offer.
The strategy ebook is given out to registered users only. To give it out for free would not be fair towards the people who have paid for that information.
Danny
Thank you for the reply. Will test with the info i have available.