The LT for October did a mixed job. The expected strong period in the second week did not pan out at all and the market just went into a steady decline. The projected weakness in the second half of the month was obviously correct. For November the expected pattern looks like this:
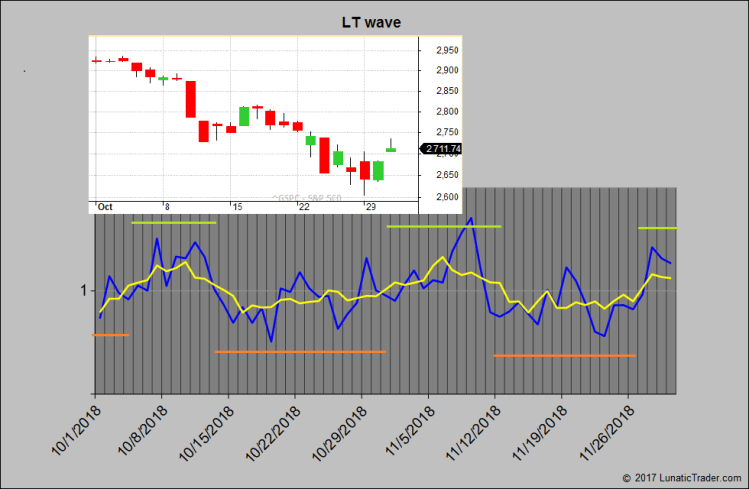
A positive bias is expected to continue until around the 11th with a noticeable peak value on the 9th. Then there is a weaker period until the 26th followed by more positive values in the final days of the month.

But we got that bounce to 2750 area you suggested we needed before we continue down and have. Do you find the green time doesnt work well in a strong downtrend?
Hi Andrew. In strong down trends the expected rallies tend to be smaller or washed away completely. In strong up trends the same happens with expected pullbacks. In sideways markets it is more easy for the lunar cycle to show up.
So the 60% rule applies: https://lunatictrader.com/2014/02/10/the-60-rule/