June was not an easy month for trading our LT wave: https://lunatictrader.wordpress.com/2019/06/03/lt-wave-for-june-2019/
Expected strength in the first week pushed the S&P back above 2900. The weaker second half of the month did not produce much downside action, the market kept climbing, but at a slower rate.
This suggests the path of least resistance is up.
Here is the LT wave for July:
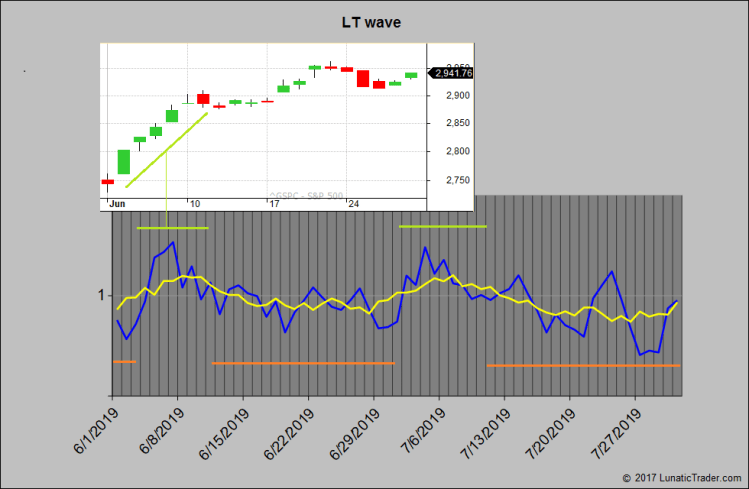
Again we have projected early month strength. The highest LT wave value comes on the 4th, but there is likely to be carry on momentum until around the 10th. The second half of the month looks weak again, but with more negative extremes than last month. The lowest LT wave values come in the 27-29th period.
Good luck.

Hi Danny,
What is the performance of the LT Wave for trading in terms of CAGR and MAx DD since you introduced it to this site?
I think I read you said backtesting for it when you first introduced was very good. Interested in performance since then.
Thanks!
Hi,
Not enough out of sample data to do a useful calculation on that. It would also depend on how you trade the LT wave.
The longest forward test we have is for the normal lunar green and red periods, which is on this page: https://lunatictrader.com/performance/