After a few weak months our LT wave seems to have kicked back into the proper gear. This is the projected price pattern for S&P 500 in January:
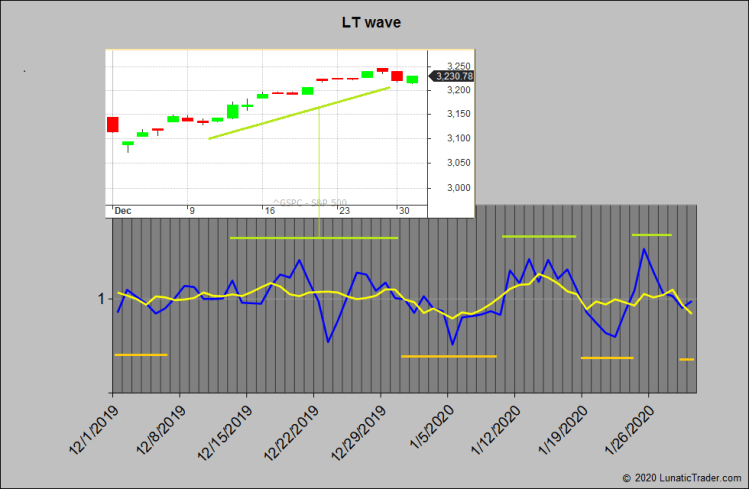
After expected weakness in early December the market flatlined a bit before bursting higher in the subsequent strong period. For January the wave suggests a weak period until around the 9th, followed by a stronger week. Weakness kicks in again after the 19th, only interrupted by a few strong days around the 25th.
Good luck and happy 2020s.

Hi Danny, I wanted to ask if the LT Wave chart for the coming weeks are available now for paid subscribers. If you can get back to me I would appreciate it. Thank you
The LT wave is not given to paid subscribers. I post it on the blog on a when-time-permits basis, usually close to the start of the new months because then I can give more relevant comments on it.
Danny
Hi Danny
What is the blue curve vs the yellow curve ? are the horizontal lines green and red your lunar cycles?
Hi,
More info is in the old articles linked from this page: https://lunatictrader.com/lt-wave-chart/
The horizontal lines are just used to mark the stronger and weaker periods. They do not always correspond to the lunar red and green periods.