The LT wave had a good month in September.
Expected weakness in the first half of the month was right on target. I warned to be careful because not all weak periods produce gentle sideways. Indeed, the market dropped a few hundred points very quickly. The 3rd week was projected to be stronger, but all we got was a few dead cat bounce days. The low of the month was reached on the 24th, exactly on a bottom day in the blue line. Here is the wave for October:
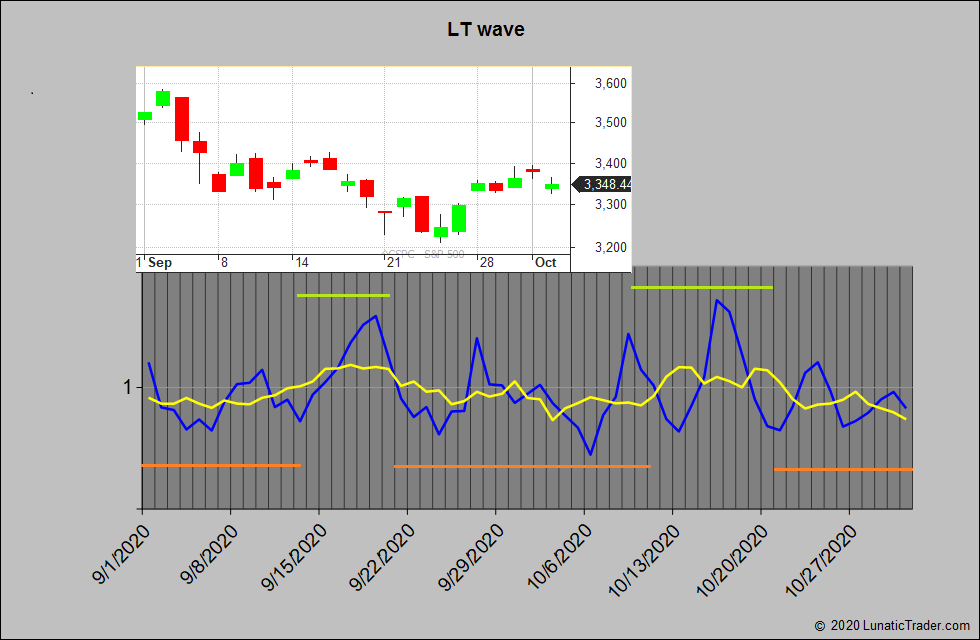
The pattern is very similar to September. Weakness until around the 10th, followed by a stronger week. There is a high peak value on the 16th. And the final week of the month looks weaker again.
Good luck.

I am VERY curious what method you use to make these LT wave charts. Do you use all moves from the past and combine these ? Like all october 6 data from the SP500 from the past 20 years or so and compare that to all october 5 data to make the blue line go up or down on the 6th compared to the 5th ? Or does is also have moon cycles in its formula. ? Can you say a little something about this ? It really seems to work more often than not…
Hi, Some basic info on the LT wave is in the articles linked here: https://lunatictrader.com/lt-wave-chart/
Thanks Danny, I like them. Is it possible to make the chart for the upcoming new month a few days earlier, so that like today 30 oct we already kno a little bit about early november ?
Can you please explain how to read the yellow and blue lines? Thanks!
See the articles linked here: https://lunatictrader.com/lt-wave-chart/