A happy new year to all our readers. Some have been here for 10+ years, others have just arrived. Thanks all. Enjoy 2025!
The LT wave had another fairly good month in December.
The expected weakness in the first weeks saw the market stagnate after recording a new record high in the first trading days. The index held up until the middle of the third week, but the few stronger days that were projected for that period could not mask the gradual loss of upward momentum. The break down day came on the 18th (note: how the 19th was the days with the lowest value for the month in the shorter term blue line), and the low of the month was seen on the 20th. There was a rebound attempt in the final holiday week, but we can see that this a rather week ending for December, which is historically a strong month. Here is the LT wave for January:
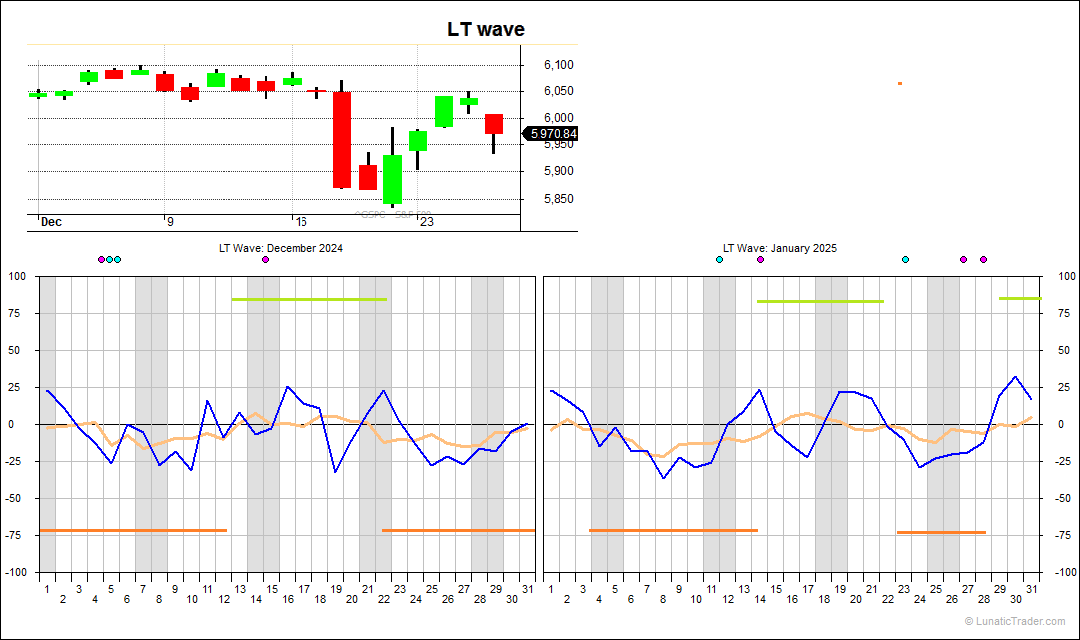
The LT wave pattern for January is similar to December. First few days are slightly on the positive side, but trading will be very thin, as many traders will take the longer new year holiday. The first full trading week of the year, starting on the 6th, comes with a negative LT wave bias, with a more positive period then starting on the 14th. From 23rd until 28th we get a weak period. The final days of the month are stronger again. January is usually also a strong month, so we will see.
For the newer readers: the orange line is just a smoothing filter, the blue values are shorter term and can dance around more. If the blue line jumps above zero, with the orange staying below zero, it will usually just mark a stronger day or rebound within a weaker sideway period or ongoing downturn. A good example was Dec 11 in this chart. But remember, this will all “work” with the imperfections that always come with trying to predict the future, which means it will also put you on the wrong foot from time to time. For January we see the lowest blue line value on the 8th and the highest blue line peak on the 30th. It’s good to keep that mind, but it’s important not to get “married” to that outcome. Lunar cycles can and will fail, because lunar cycles are a weak effect at best and there are many other factors that can move stocks, e.g. unexpected news items. So, part of using this method is careful observation to determine if the cycle is ON or OFF. In this case, if something that can be a tradeable low is seen on the 8th or 10th, then you can use it to step in. If market action does not line up in any way with the expected cycle pattern, then consider the cycle OFF and wait for clearer skies. If you can be correct in that assessment about 60% of the time, then you will do very well in your trading. This is never an easy task, you are working with small edges. If over a given period you get it right 80% of the time, then consider yourself good and lucky. It will not last, but you have to take advantage of summer while it lasts. Profits come in clusters and the market is not always in a “giving mood”. There will also be periods when you are only getting it right 30 or 40% of the time. You will have to survive those times. The best traders are not always those who get it right more often. The best traders are usually the ones who are quicker to realise (and act) when they are wrong, and it are the ones who know when not to trade (that is, when their edge is off…).
See also this older article about the 60% rule.
Cheers.
Normal caveats apply: the LT wave is experimental and purely based on natural cycles, so doesn’t use any market or price inputs. Don’t bet the farm on it.
Subscribe to our blog if you want to get an email each time we post new information. It’s free.

New subscriber for your blog here. I like your work!
I can’t seem to find the exact meaning of the purple and light blue dots above the charts. What are they?
Hi Aron. Welcome. The purple and blue dots mark “planetary extremes” and will sometimes mark turning points very closely. Will explain that in more detail when the next version of LunaticTrader is ready. Stay tuned.
Such a warm reminder!
Glad you like it.