The LT wave had an excellent month in January.
The first few days were positive, as expected. Then the market dipped in the second week, as the wave had indicated. The more positive period starting from the 14th came right on the mark as well. The SPX climbed to a new all time closing high on the 23rd, when the strong period was expected to end. Even the rebound attempt in the final days came on time. It doesn’t get much better than that, so don’t take this as a reason to become overconfident in lunar cycles. Here is the LT wave for February:
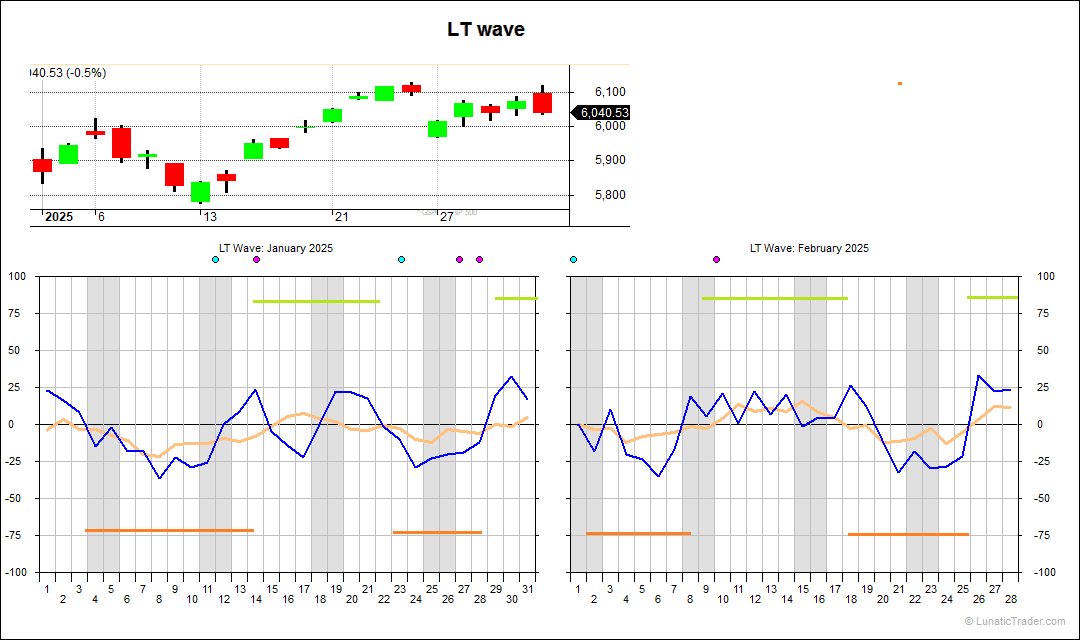
The LT wave pattern for February is similar to January again. It starts with a weak period in the first week, followed by a better period until around the 18th. Then another weaker period until the 25th. The final days of the month are projected to be strong.
Normal caveats apply: the LT wave is experimental and purely based on natural cycles, so doesn’t use any market or price inputs. Don’t bet the farm on it.
Subscribe to our blog if you want to get an email each time we post new information. It’s free.

1 comment