The LT wave did fairly well in January.
The start was pretty good, as expected, and then stocks went largely sideways until the second weekend. The period of weakness starting around the 11th was rather mild at first and then intensified near the middle of the month.There was a suprisingly strong rebound rally, which was not indicated by the wave, but weakness returned in the final days.
Here is the LT wave for February:
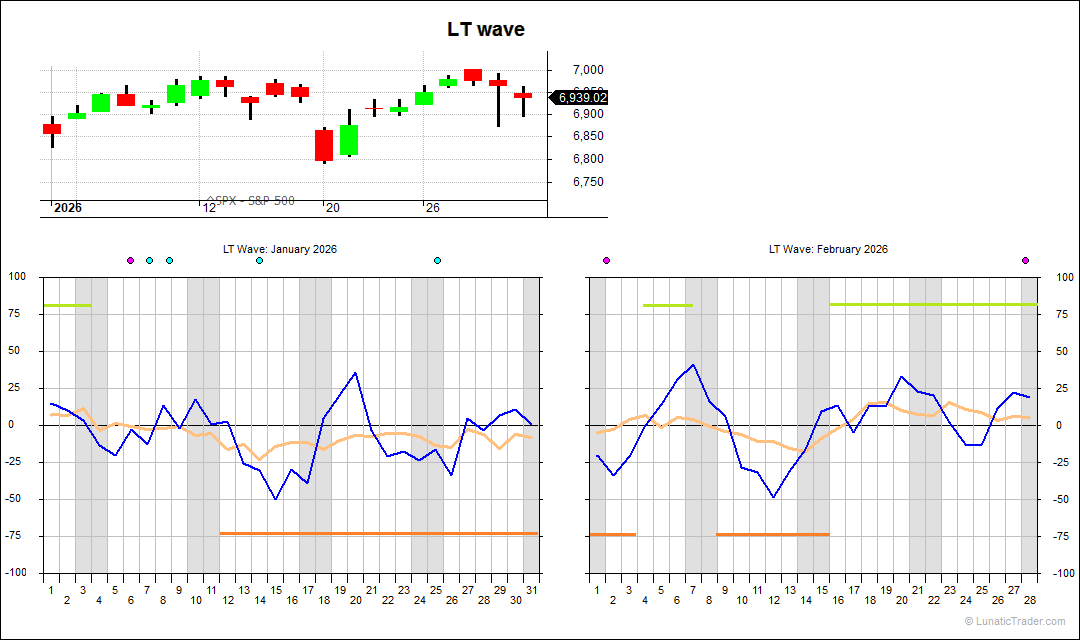
Here we see a weak start to the month, but then a possible rebound at the end of the first week. The second week is negative, to be followed by projected strength for the final two weeks.
Let’s see.
The usual caveats apply: the LT wave is experimental and purely based on natural cycles, so not on market or price data. Don’t bet the farm on it.
Subscribe to our blog if you want to get an email each time we post new information. It’s free.

1 comment