The LT wave had another good month in February.
Weakness in the first days and a rebound at the end of the first week came right on the mark. Those gains were given back in the second week, which was projected to be weaker. Stocks traded with a small upward bias in the final two weeks. That fits the expected pattern, but we have to observe that it was not a convincing rally.
Here is the LT wave for March:
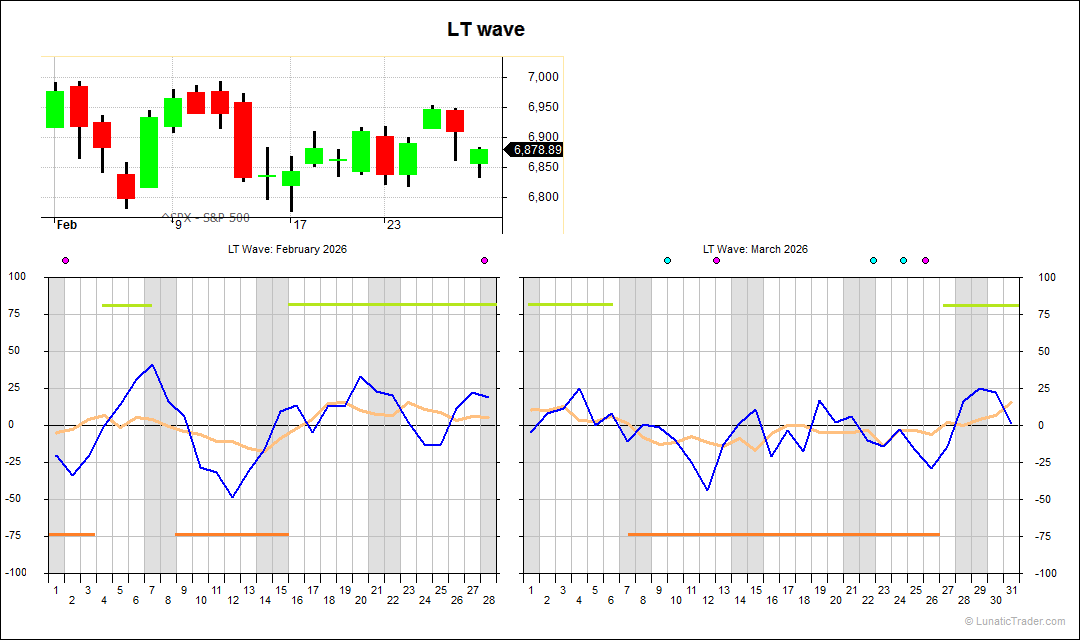
The wave shows strength in the first days, which quickly falls to neutral by the end of the first week. Then three weeks of mostly negative LT wave values. The blue line getting above zero a few time may indicate rebound days, but that will not always work equally well, so use with the necessary caution. The final days of the month are more positive again.
Maybe it’s good to remind readers that lunar cycles are not a strong effect and can be “washed out” if major news items take precedence. The events in Iran over the weekend may be such a case, but we will see. When lunar cycles get knocked off, they tend to come back to normal a few weeks of months later. There is no perfection in this kind of cyclical work.
The usual caveats apply: the LT wave is experimental and purely based on natural cycles, so not on market or price data. Don’t bet the farm on it.
Subscribe to our blog if you want to get an email each time we post new information. It’s free.
