We didn’t get around to make a full blog post for July, but the LT wave was posted on X.
The projected pattern held up well, even though the upside was quite weak in the stronger period. The low of the month came in the final week, which matched the expectation.
Here is the LT wave for August:
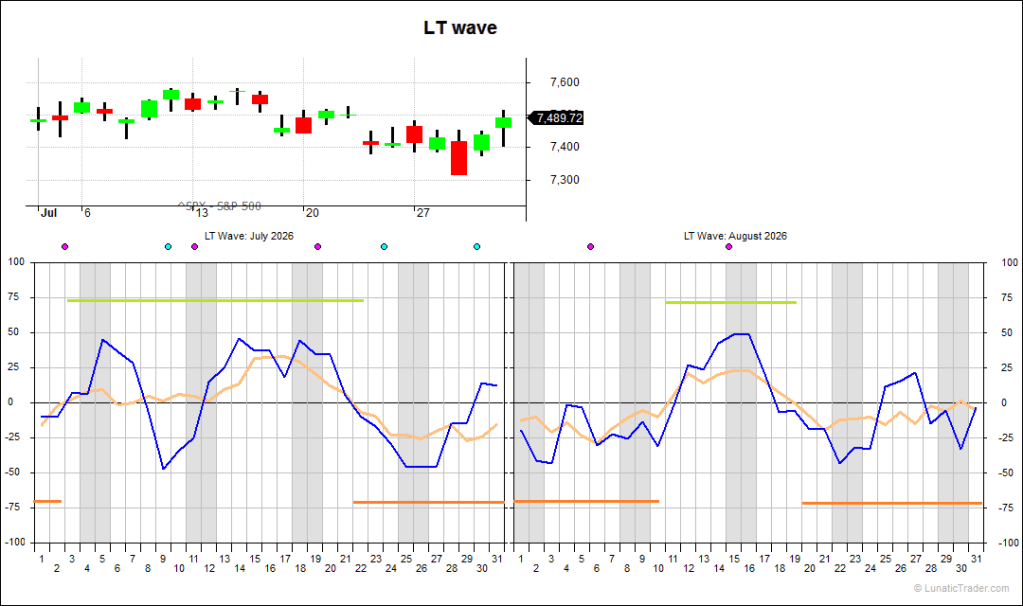
Weakness continues until around the 10th. Then a stronger period until the 19th, followed by weakness for the rest of August. Note that the final 5 days are close to neutral, and the blue line makes late peaks 25th-27th. Those days can surprise to the upside and we will need to keep eyes and minds open. When the blue and orange lines are on opposite sides of zero the outcome is more uncertain.
Subscribe to our blog if you want to get an email each time we post new information. It’s free.

 LunaticTrader Blog
1 comment