The LT wave did fairly well in October.
The market did go up in the stronger period until around the 14th, and then declined in the subsequent weaker period. The expected stronger period after the 22nd was rather shortlived and the final days of the month were much weaker than our wave chart suggested. But of course, there is no perfection in this kind of work.
Here is the LT wave for November:
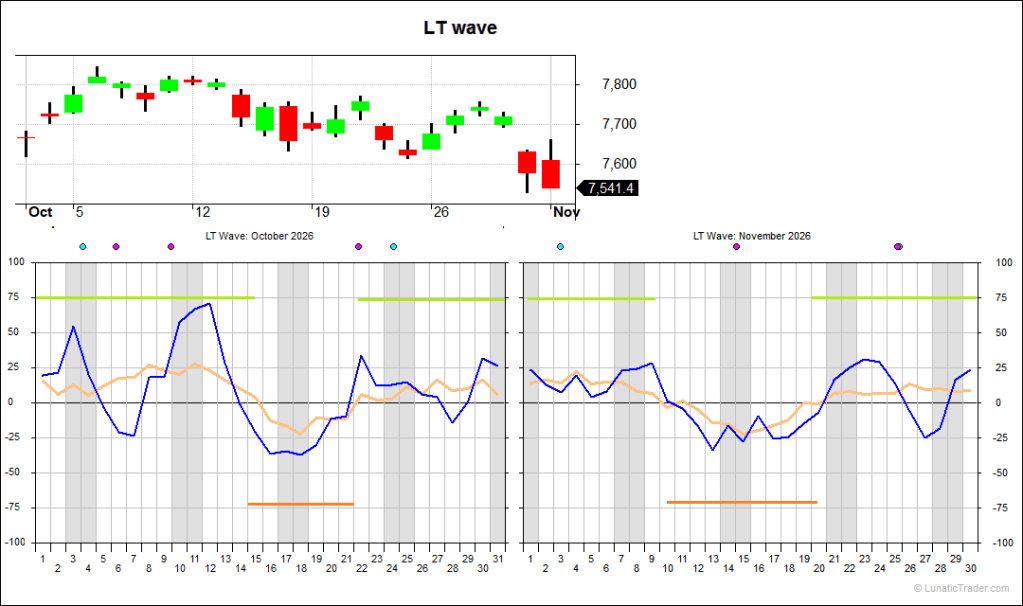
A strong period until around the 9th, followed by weakness until the 20th.
The final 10 days of the month are strong again. So, the projected pattern is very similar to October.
The usual caveats apply: the LT wave is experimental and purely based on natural cycles, so not on market or price data. Don’t bet the farm on it.
Subscribe to our blog if you want to get an email each time we post new information. It’s free.


